
What Automation Tool Suits YOUR Business

When it comes to automating workflows and integrating various apps and services, three major players dominate the field: Zapier, Make (formerly Integromat), and n8n. Each of these platforms has its unique strengths and caters to different user needs. Below is a high-level comparison to help you understand which tool might be the best fit for your automation projects. Zapier: The User-Friendly Giant Zapier is often the first name that comes to mind when thinking about no-code automation. Its intuitive interface makes it accessible for beginners and those who need to set up simple workflows quickly. Zapier supports thousands of apps, making it a versatile choice for a wide range of automation tasks. Its drag-and-drop builder allows users to create “Zaps” (workflows) with minimal effort, making it an ideal choice for small businesses or individuals who need to automate routine tasks without getting into the technical details. However, Zapier has some limitations. It can become expensive as your automation needs grow, and its simplicity might restrict more complex workflows. Additionally, its reliance on pre-built templates can sometimes limit customization, making it less ideal for intricate, multi-step processes that require advanced logic. Make: The Powerhouse for Complex Workflows Make, formerly known as Integromat, is a robust platform designed for those who need more control and customization in their workflows. It offers a visual, flowchart-like interface that allows users to build complex automations involving multiple apps, conditional logic, data transformation, and more. Make’s flexibility makes it suitable for businesses with advanced automation needs that go beyond simple tasks. One of the standout features of Make is its pricing model, which can be more affordable for users with extensive automation needs compared to Zapier. However, its steep learning curve can be a barrier for beginners. Make is ideal for users who are comfortable with technology and need a platform that can handle sophisticated workflows with precision. n8n: The Open-Source Contender n8n is the new kid on the block, and it stands out for being open-source. This gives users full control over their automation workflows, with the ability to self-host and customize their setups extensively. n8n is perfect for developers and tech-savvy users who want the freedom to build highly customized automations without the constraints of a proprietary platform. While n8n is powerful, it also comes with challenges. Setting up and maintaining a self-hosted instance can require significant technical knowledge and resources. However, for those who need maximum flexibility and control, n8n is a compelling choice, especially for businesses with unique or highly specific automation needs. Conclusion Choosing between Zapier, Make, and n8n depends largely on your specific needs, technical expertise, and budget. Zapier is perfect for straightforward, quick setups, Make shines in complex workflows, and n8n offers unparalleled customization for those willing to manage the technical aspects. Understanding the strengths and limitations of each platform will help you select the best tool for your automation projects.
Best Practices for Building Airtable Interfaces

Airtable Interfaces are powerful tools that can transform complex data into user-friendly, interactive dashboards and forms. However, designing effective interfaces requires more than just dragging and dropping fields. To create an interface that not only looks good but also functions smoothly, there are a few best practices you should keep in mind. Auto-Document the Interface One of the most crucial aspects of any interface design is clear documentation. Airtable allows you to add headers, helper text, and descriptions to various elements within your interface. Utilize these features to guide users through the interface. For instance, if your interface includes multiple sections or tabs, use headers to clearly label each section. Descriptions or helper text should be used to provide context or instructions. This not only improves the usability of the interface but also helps onboard new users faster. When users understand what they’re looking at and how to interact with it, they’re less likely to make errors or become frustrated. Consistent Grouping and Structure Consistency is key when designing interfaces, especially when you have multiple pages or tabs. The more uniform your design, the easier it will be for users to navigate and understand the information presented to them. Maintain similar grouping and structure across different pages to ensure that users can easily find what they’re looking for, regardless of where they are in the interface. For example, if you have a “Summary” group at the top of one page, keep that same structure on other pages where a summary is applicable. This consistent layout reduces the cognitive load on users, making the interface more intuitive and user-friendly. Less is More: Focus on Specific User Stories When building Airtable Interfaces, it’s tempting to pack as much information as possible into a single screen. However, this approach can quickly lead to clutter and overwhelm. Instead, focus on specific user stories and roles per interface. By tailoring each interface to a specific function or user role, you can create a more streamlined experience. For example, an interface for project managers might focus on task tracking and deadlines, while an interface for team members could prioritize daily tasks and communication. This “less is more” approach not only simplifies the interface but also makes it more effective for its intended users. Use of Emojis and Background Colors for Visual Appeal Airtable interfaces can sometimes feel a bit dull, especially when dealing with large datasets or complex systems. To inject some visual appeal and make the interface more engaging, consider using emojis and the “show background color” option for groups. Emojis can be a fun and effective way to add a visual cue or highlight important sections. For example, using a checkmark emoji next to completed tasks or a warning sign next to urgent issues can quickly convey status without needing additional text. Similarly, enabling background colors for different groups can help break up the monotony of white space, making it easier for users to distinguish between sections at a glance. Beware of Mobile Friendliness Airtable Interfaces are primarily designed for desktop use, but with the growing reliance on mobile devices, it’s important to consider how your interfaces will appear on smaller screens. Not all layouts are mobile-friendly, and an interface that looks great on a desktop might be difficult to navigate on a smartphone or tablet. To ensure mobile usability, stick to simple layouts and avoid overcrowding the interface with too many elements. Test your interfaces on different devices and screen sizes to see how they perform. If certain elements don’t translate well to mobile, consider creating a separate, simplified version of the interface specifically for mobile users. Conclusion Building effective Airtable Interfaces requires a balance of functionality, simplicity, and user-centered design. By auto-documenting your interfaces, maintaining consistent structures, focusing on specific user stories, and considering mobile-friendliness, you can create interfaces that are not only powerful but also a joy to use. Additionally, don’t underestimate the impact of visual elements like emojis and background colors—they can make your interfaces more engaging and easier to navigate. Remember, the goal is to make data accessible and actionable for users, and these best practices will help you achieve that. Get access to the full Airtable best practices checklist here.
How to build an Invoice Parsing Tool on Airtable (AI)
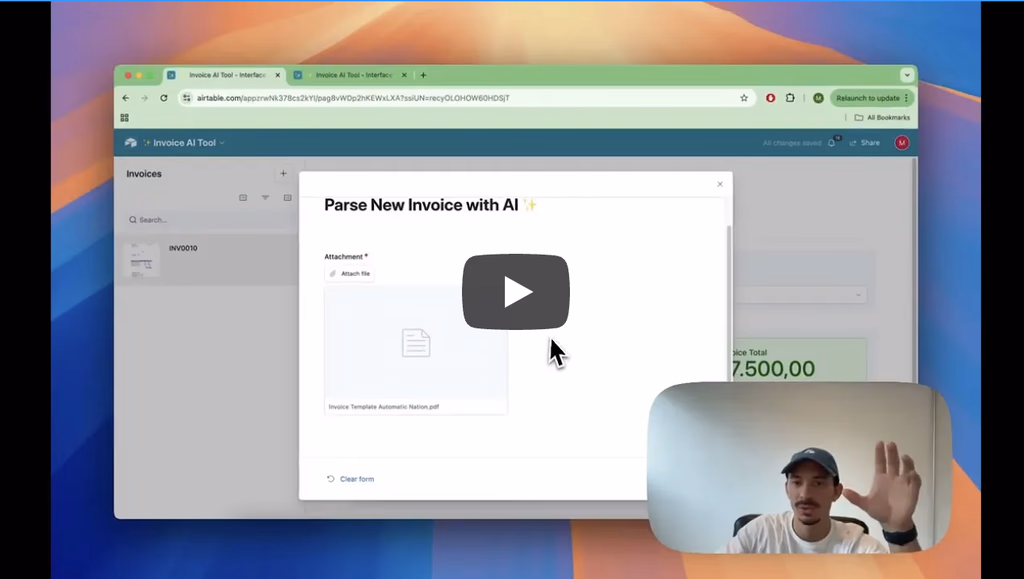
In case you where not fully aware, it is completely possible to build an invoice parsing tool using Airtable’s AI features. A friend of mine was spending over 2 hours a day manually typing out invoice details into a spreadsheet, copying numbers and line item descriptions one by one. Built this super simple set up and he’s completely blown away by how much time it saves. That inspired to make this video and share it here. Current use case:1. Upload Invoice.2. Automation uses AI to extract Invoice Line Item Descriptions, Quantity and Totals.3. Automation creates corresponding records with precise information.4. My friend can now get all insights from the invoices his company receives (how much they’re spending, what they’re spending on, and a clear picture of overall finances). If you need any assistance building this, feel free to grab a slot using this link!
Airtable’s AI Field: A Quick Guide

Have you ever wished your Airtable base could automatically generate text, summarize content, or analyze patterns without manual input? With Airtable’s AI Field, you can do just that! This new feature harnesses the power of artificial intelligence to simplify workflows, enhance data insights, and save time. Whether you want to generate product descriptions, craft email drafts, or categorize text data, Airtable’s AI Field makes it easy. Let’s walk through how it works, how to set it up, and why it’s a game-changer for your data-driven workflows. How to Set Up an AI Field in Airtable 1. Open Your Table Navigate to the table where you want to add AI-powered capabilities. 2. Add a New Field Click the “+” button to add a new field. Select “AI” as the field type (note that this is a Teams plan feature). 3. Choose Your AI Task Airtable will allow you to either (i) Generate text; or (ii) Suggest records to link to. Whilst the latter will create a linked record field, where the AI will be suggesting what record(s) to link to the record you are working on based on the context provided from specific fields you’ll be selecting, the former will automatically generate text for you depending on a given template or prompt. For suggesting records, the configuration will look like this: For generating text, the options will be these: If you’d like to go with a template, Airtable will provide several different options as shown below! Otherwise, you can set your own prompt! The AI Field can pull data from other fields in the same record. Use curly braces (e.g., {Product Name}) to reference fields dynamically. -see image below. For example: • For generating product descriptions: “Write a product description for {Product Name}, highlighting its features: {Features}.” • For sentiment analysis: “Analyze the sentiment of this customer review: {Review Text}.” 4. Create the Field and Test Once you create the field, you can review the generated content and refine the prompt if needed. Why the AI Field Is Useful Automates Repetitive Tasks: Stop manually writing product descriptions, summaries, or tags. The AI Field can handle these tasks automatically. Improves Data Quality: Consistent descriptions, categories, and tags make your database more reliable and easier to analyze. Saves Time: AI-generated content frees your team to focus on more strategic work. Flexible and Customizable: The AI Field can adapt to various tasks with simple prompt adjustments. Use Cases for the AI Field Marketing Teams: • Generate social media captions based on campaign details. • Write product descriptions using product features and benefits. Sales and CRM: • Summarize meeting notes directly in your CRM. • Auto-generate personalized follow-up emails using customer names and previous interactions. Customer Support: • Analyze support tickets to determine sentiment and urgency. • Generate knowledge base articles based on FAQs. Content Creation: • Translate blog post summaries into multiple languages. • Generate SEO-friendly descriptions for website pages. Tips for Getting the Most Out of AI Fields • Be Specific with Prompts: The more detailed your instructions, the better the results. • Test and Refine: Run test records to fine-tune prompts for accuracy. • Combine with Automations: Trigger AI tasks when new records are added or updated. • Use Clear Context: If your prompt requires background information, make sure the fields used are descriptive and consistent. Conclusion Airtable’s AI Field adds a new level of intelligence to your databases, automating repetitive tasks and generating useful insights with ease. Whether you’re writing content, categorizing feedback, or analyzing text, this feature helps you work smarter, not harder. Try adding an AI Field to your Airtable base today and experience how automation can simplify your workflow!
Airtable’s Rollup Field: A Quick Guide

Have you ever wanted to summarize or calculate data across linked records in Airtable? With Rollup Fields, you can achieve exactly that! A Rollup Field in Airtable allows you to aggregate data from linked records, applying functions like sum, average, count, and more. Whether you need to total expenses for a project, calculate an average rating for customer feedback, or track the latest order date for a client, Rollup Fields help automate these calculations without manual data entry. Let’s explore how to set them up and why they are so powerful. How to Set Up a Rollup Field 1. Ensure You Have a Linked Record Field: Rollup Fields work by aggregating data from linked records. Start by making sure your table has a Linked Record Field connecting it to another table. For example, a Projects table linked to a Tasks table. 2. Add a Rollup Field: In your table, click the “+” button to add a new field and select Rollup as the field type. 3. Choose the Linked Field: Select the Linked Record Field that connects your table to another table. 4. Select the Field to Roll Up: Choose the specific field from the linked table that you want to summarize. For example, if rolling up tasks in a project, you might select a “Task Duration” field to calculate total time spent. 5. Apply a Function: Airtable offers built-in functions like: • SUM(values): Adds up all values in the linked records. • AVERAGE(values): Calculates the average. • MAX(values): Returns the highest value. • ARRAYJOIN(values, “, “): Lists all values as a text string. • COUNTALL(values): Counts how many linked records exist. 6. Add an Optional Condition: You can filter which records get included in the rollup. For example, only sum completed tasks by setting {Status} = “Complete”. 7. Save the Field: Airtable will automatically calculate the rollup based on the linked records. Why Rollup Fields Are Useful Automated Calculations: No need for manual data entry—Rollup Fields dynamically update as records change. Summarized Insights: Quickly see totals, averages, or key statistics at a glance. Conditional Logic: Apply filters to roll up only relevant records, such as completed tasks or paid invoices. Better Organization: Rollup Fields keep your tables structured by eliminating the need for repetitive calculations. Use Cases for Rollup Fields Project Management: Roll up task durations to calculate the total time spent on a project. Use SUM(values) to get the total hours. Sales Tracking: Roll up order values in a “Customers” table to see the total amount each customer has spent. Inventory Management: Roll up stock levels from multiple warehouse locations to get the total available stock. Event Planning: Roll up RSVP responses to count confirmed attendees. Customer Feedback: Roll up review scores to get the average rating per product using AVERAGE(values). Conclusion Airtable’s Rollup Field is a game-changer for summarizing and calculating data across linked records. Whether you’re tracking project hours, sales revenue, or customer feedback, Rollup Fields provide automated insights with minimal effort. Try adding a Rollup Field to your Airtable base today and streamline your workflow! Psst. you might also be interested in reading about Airtable’s lookup fields.
Airtable Automation Limits: What You Need to Know

Airtable automations are a powerful way to streamline workflows, minimize repetitive tasks, and improve overall productivity. However, Airtable imposes two key limits on automations: (i) the total number of automations you can have per base; and (ii) the number of automation runs allowed per month. Understanding these limits is essential to ensure your workflows operate efficiently without interruptions. Let’s break it down. What Are the Two Types of Automation Limits? 1. Total Automations Per Base Each Airtable base can have up to 50 automations. This limit includes both active (turned on) and inactive (turned off) automations. Even if you’re not using some of your automations, they still count toward the total. If you hit this cap, you’ll need to consolidate workflows or delete unused automations to make room for new ones. 2. Automation Runs Per Month The number of automation runs per month depends on your Airtable plan: Free Plan: 100 automation runs/month Team Plan: 25,000 automation runs/month Business Plan: 100,000 automation runs/month Enterprise Plan: 500,000 automation runs/month An automation run is counted every time an automation workflow is triggered, regardless of whether it completes successfully or fails, or whether it executes one action or multiple actions. What Counts as an Automation Run? 1. Triggered Events Each time the trigger condition for an automation is met—such as when a new record is created or updated, or a scheduled time arrives—it counts as one run. This applies even if the automation fails to execute successfully. 2. Grouped Actions An automation can include multiple actions (e.g., sending an email, updating a record, posting to Slack). These actions are grouped under a single trigger, so no matter how many actions the automation performs, the entire process counts as one run. How to Optimize Both Automation Limits Managing these two limits effectively is key to maximizing the potential of Airtable automations. Here are some strategies: 1. Consolidate Automations • Instead of creating multiple separate automations with similar triggers, combine them into a single automation with conditional logic or multiple actions. This reduces the number of automations and keeps you within the 50-automation limit. 2. Be Specific about Conditions • Use very specific conditions under the “When a record matches conditions…” trigger, to ensure that automations only run when necessary. This prevents runs from being consumed unnecessarily. 3. Audit and Streamline • Regularly review your automations to deactivate or delete workflows that are no longer in use. This helps free up space within your 50-automation cap and ensures runs aren’t wasted. 4. Minimize Testing • Plan your automation logic carefully to reduce the number of tests during development. 5. Use Batch Processes • If your workflows involve updating many records, consider using Airtable scripting or third-party tools like Zapier, Make, or N8N, to perform batch updates without triggering excessive automation runs. Check this post for more information on what automation software is best for you. What Happens If You Exceed These Limits? 1. If You Reach the 50-Automation Cap: • You won’t be able to create new automations until you delete or consolidate existing ones. 2. If You Exceed Your Monthly Run Limit: • Automations will stop functioning until the next billing cycle begins. • To prevent disruptions, upgrade to a plan with a higher run limit if your workflows consistently exceed your current quota. Conclusion Understanding both the 50-automation limit per base and the monthly automation run limits is critical to building efficient, scalable workflows in Airtable. By consolidating workflows, optimizing automation logic, and tracking your usage, you can ensure your processes run smoothly without hitting these constraints. Airtable automations are a powerful tool, and with proper planning, you can leverage them to their fullest potential while staying within your plan’s limits. Make sure to reach out to an Airtable Expert for assistance.
Airtable’s Views: A Quick Guide

Have you ever wished for a way to display your data exactly how you need it, whether that’s for organizing tasks, tracking progress, or presenting information? With Views in Airtable, you can achieve all that and more! A View in Airtable is a customizable way to display and interact with your data. Each table can have multiple views, allowing you to organize the same data in different ways for different purposes. From simple grids to Kanban boards and calendars, Views let you tailor your tables to fit your workflow and focus on what matters most. Let’s explore how to set up Views, why they’re so powerful, and how they can transform your Airtable experience. How to Set Up a View in Airtable 1. Open Your Table: Start by opening the table in which you want to create the view. Each table’s default view is typically a Grid View. 2. Click “Views”: On the top left corner, click on “Views” to expand the left sidebar (if not expanded already). 3. Choose a View Type: Select the type of view that best suits your needs. Airtable offers several options, which are shown as options on the left margin (bottom section): • Grid View: The classic spreadsheet layout, perfect for editing and organizing data. • Calendar View: Displays records with dates in a calendar format. • Gallery View: Ideal for showcasing visual or creative content. • Kanban View: Great for visualizing workflows, grouped by a single select or status field. • Timeline View: Displays records along a horizontal timeline, perfect for tracking schedules and project phases. • List View: A streamlined format for viewing records one by one, great for focused task or entry management. • Gantt View: A project planning view that shows tasks as timeline bars with dependencies for managing complex workflows. • Form View: Allows you to collect data through a user-friendly form. 4. Create the View: Click the corresponding “+” next to the Views type that you’d like to create. Do note that you can create multiple views for the same table, each customized to serve a specific purpose! • In a Grid View, filter for tasks marked as “In Progress” and hide unnecessary fields. • In a Kanban View, group tasks by their current stage, like “To Do,” “In Progress,” and “Complete.” • In a Calendar View, show only deadlines for the next month. Why Views Are Useful Multiple Perspectives: Each table can have multiple views, enabling you to see your data from different angles. For example, one view could focus on high-priority tasks, while another provides a calendar of deadlines. Customizable Display: Views let you adapt your data layout to match the way you work, whether that’s visually, chronologically, or grouped by categories (more on Airtable’s grouping feature here). Focus on What Matters: By using filters and field visibility settings, Views help you focus on specific parts of your data, such as tasks due this week or high-priority items. Improved Collaboration: Create Views tailored to team roles or individual needs, ensuring everyone sees the most relevant data without clutter. Dynamic Updates: Views automatically reflect changes made to records, keeping everything up to date in real time. Use Cases for Airtable Views Project Management: Use a Kanban View to track tasks across stages like “To Do,” “In Progress,” and “Complete,” while a Calendar View maps out project deadlines. Maintain a Grid View for detailed task tracking. CRM: Create a Grid View for detailed client data, a Gallery View for visualizing customer profiles, and a Kanban View for tracking leads through stages like “New,” “Contacted,” and “Closed.” Event Planning: Use a Calendar View to track important dates, a Grid View to organize vendor details, and a Form View to collect RSVPs or feedback. Inventory Management: Set up a Grid View for tracking stock levels and a Kanban View to monitor items through procurement, shipping, and delivery. Content Creation: Build a Gallery View to showcase designs or photos, a Kanban View to track content through idea, draft, and published stages, and a Calendar View to schedule release dates. Conclusion Airtable’s Views are one of its most versatile and powerful features, giving you the flexibility to display your data in ways that suit your workflow. Each table can have multiple views, allowing you to switch between perspectives depending on your needs. Whether you’re managing projects, planning events, or tracking sales, Views help you focus on what matters most and make sense of your data at a glance. Experiment with different Views in your next project and unlock the full potential of Airtable!
Airtable’s Grouping Feature: A Quick Guide

Have you ever wanted to organize your Airtable data visually, making it easier to spot trends or categorize records? With Groups, you can achieve just that! A Group in Airtable allows you to cluster your records by shared values in a specific field, creating a clear and organized view of your data. Whether you’re tracking tasks, managing inventory, or analyzing sales, the Group feature helps you focus on what matters most at a glance. Let’s dive into how it works and why it’s so powerful. How to Set Up a Group in Airtable 1. Open Your Table and Choose the Specific View: Go to the table and view you’d like to organize (for more information on Airtable views, feel free to read this other post). Make sure it has at least one field containing values you’d like to group by (e.g., task status, project name, or category). 2. Click the “Group” Button: At the top of your table view, click the “Group” button. A dropdown will appear with a list of all your fields. 3. Select a Field to Group By: Choose the field whose values will determine your groups. For example, group tasks by “Status” to see tasks in categories like “To Do,” “In Progress,” and “Complete.” Or, group sales by “Region” to analyze performance geographically. 4. Customize Your Groups (Optional): You can collapse groups by clicking the small arrow next to a group header, sort records within groups by clicking the sorting option, or add multiple group levels to nest groups. For instance, group by “Region” first, then by “Salesperson.” Why the Group Feature Is Useful Improves Organization: Grouping records clusters them by key categories, making it easy to navigate and analyze large datasets. Visual Clarity: Seeing records grouped together makes patterns and outliers stand out. For example, you can quickly identify which tasks are overdue or which categories are driving the most revenue. Flexible and Dynamic: Groups update automatically as your data changes. If a task moves from “In Progress” to “Complete,” it will appear in the correct group instantly. Enhanced Collaboration: Teams can focus on specific groups relevant to their responsibilities, streamlining collaboration. Use Cases for the Group Feature Project Management: Group tasks by “Status” to quickly see which ones are “To Do,” “In Progress,” or “Complete.” Add a second group level for “Assigned To” to break tasks down by team member. Sales Analysis: Group records by “Region” to analyze performance geographically. Add a second group for “Salesperson” to evaluate individual contributions. Inventory Management: Group products by “Category” to review stock levels across product types. Event Planning: Group attendees by “RSVP Status” to see who’s confirmed, declined, or hasn’t responded yet. Conclusion Airtable’s Group feature is a simple yet powerful way to organize and analyze your data. By clustering records based on shared values, you gain visual clarity, improve collaboration, and unlock insights that might otherwise be hard to see. Whether you’re managing tasks, tracking sales, or planning events, Groups help you make sense of your data at a glance. Try using the Group feature in your next project and see how it transforms your workflow!
Airtable’s Lookup Field: A Quick Guide

A Lookup Field in Airtable pulls information from linked records and displays it in your current table. This means you can reference data from one table while working in another, keeping everything connected and up-to-date. How to Set Up a Lookup Field 1. Start with a Linked Field Ensure your table has a linked field connecting it to another table (e.g., Projects linked to Tasks). 2. Add a Lookup Field • Create a new field and select “Lookup” as the type. • Choose the linked field and then the specific field from the linked table to display. 3. Set Conditions (Optional) • Add conditions directly in the Lookup Field configuration, by clicking on “Only include linked records from the Tasks table that meet certain conditions”, to filter the records being displayed. • For example, show only tasks where {Status} = “Complete” or only products with {Stock} > 0. 4. Create Field Airtable will pull and display only the data matching your conditions. Why Lookup Fields Are Useful • Dynamic Updates: Any changes made in linked records are reflected automatically. • Filtered Data: Use conditions to focus on the most relevant information, such as completed tasks or overdue invoices. • Centralized View: Pull details like contact info, product descriptions, or task statuses into one place for easy reference. Example: Managing Projects and Tasks Imagine you’re managing projects, each with multiple tasks. Your Tasks table includes details like task names, statuses, and assigned team members, all linked to a project. In your Projects table, a Lookup Field can pull task statuses or team member names directly from the linked tasks. For example, the project “Marketing Campaign” might show task statuses like “Complete” and “In Progress” or team members like “Alice” and “Bob.” If a task’s status changes in the Tasks table—say “Create Social Media” is marked as “Complete”—the Lookup Field in the Projects table will update automatically. You can also set conditions to display only incomplete tasks, helping you focus on what still needs to be done. This real-time connection ensures that critical project information is centralized, actionable, and always up-to-date. Use Cases • Project Management: Display task statuses or assigned team members for each project. • CRM: Show customer contact details or recent interactions. • Inventory: Pull product descriptions or stock availability into orders. Limitation Airtable Lookup fields do not support formulas within the field itself e.g. MAX(), MIN(), ARRAYUNIQUE(). If this is needed, you will want to use Airtable’s Rollup field instead. Conclusion Airtable’s Lookup Field makes it easy to pull data from linked records, keeping your tables up-to-date. With its ability to include only relevant data through conditions, the Lookup Field is a must-have for streamlining your workflows.
Airtable’s Count Field: How to Use It and Why It’s a Game-Changer

The Count field in Airtable is a simple but powerful tool. It allows you to count linked records in real-time and, with conditions, filter exactly which records are included in that count. Here’s a quick guide to using it effectively. How to set it up: 1. Create a Linked Field: Ensure you have a linked record field connecting two tables. For example, a “Projects” table linked to a “Tasks” table. 2. Add a Count Field: In the parent table (e.g., “Projects”), add a new field, select “Count,” and choose the linked field to count. 3. Set Conditions: Click “Only include linked records from the Tasks table that meet certain conditions” to filter the records being counted -see image below. For example: Count tasks where {Status} = “Complete”; AND Only include records with {Priority} = “High”. The Count field updates dynamically as records change in the linked table. Why It’s Powerful: Filter and Focus: Add conditions to count only the records that matter, like overdue tasks, unpaid invoices, or low-stock items. Trigger Automations: Use Count fields with Airtable’s automations to send alerts or create tasks when counts hit certain thresholds. Simplify Workflows: Avoid extra formulas or manual calculations. The Count field does it all for you. Use Cases: Project Management: Track completed vs. overdue tasks. Sales: Count open deals or high-value opportunities. Inventory: Monitor low-stock items and trigger reorders. Events: Count RSVPs or VIP attendees. The Count field may not grab headlines, but its flexibility and ease of use make it a must-have for streamlining your Airtable workflows. Try it out and see how much simpler your tracking can be! Feel free to read this other post on Airtable Lookup Fields, or this one on Airtable Rollup Fields.